Contents
Ecosystems
Key Terms
- Population – Group of organisms of the same species living in the same habitat.
- Habitat – Part of an ecosystem in which particular organisms live.
- Community – All the populations of different species in the same area at the same time.
- Ecosystem – A community and the non-living components of an environment (the biotic and abiotic factors). Ecosystems can range in size from the very small to the very large.
- Niche – An organism’s role within an ecosystem. Each species occupies its own niche governed by adaptation to both abiotic and biotic conditions.
- Carrying Capacity – The maximum population size an ecosystem can support.
- Abiotic Factors – Non-living conditions of an ecosystem.
- Biotic Factors – Impact of the interactions between organisms.
Factors Affecting Population Size
The abiotic factors within an ecosystem can affect the size of the different populations. These factors can range from temperature, oxygen and carbon dioxide concentration, light intensity, pH, and soil conditions. Plants and animals are adapted to the abiotic factors within their ecosystem. These adaptations develop through the process of natural selection over time. The less harsh the abiotic factors, such as plenty of water and light, the larger the range of species and the larger the population sizes.
Biotic factors and the living components of an ecosystem interacting together, such as interspecific and intraspecific competition and predation, also affect population size.
Interspecific competition is when members of different species are in competition for the same resource that is in limited supply. This could be competition for a habitat, food, or water. The individual better adapted to the environment is more likely to succeed in the competition.
Intraspecific competition is when members of the same species are in competition for resources and a mate. Competition for a mate links to the courtship rituals. Individuals that are fitter will have more energy to perform a more impressive courtship ritual or may have fur or feathers in better condition to attract a mate.
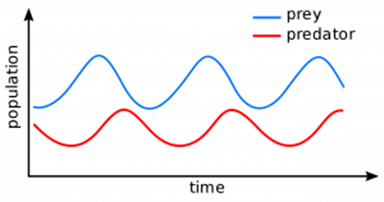
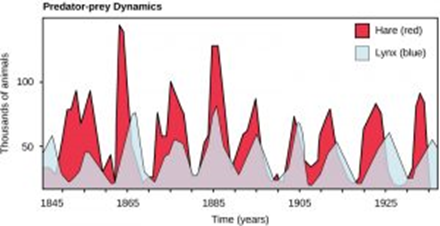
The interaction between predators and prey in a food web is represented in the graph below. Regardless of the species, the graph always follows the same pattern. The size of the predator and prey populations both fluctuate, there will always be more prey than predators, and the size of the population will always change in the prey and then the predators.
Succession
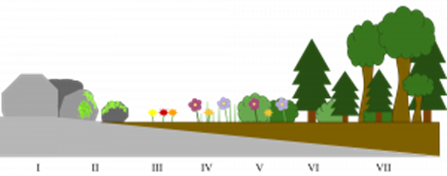
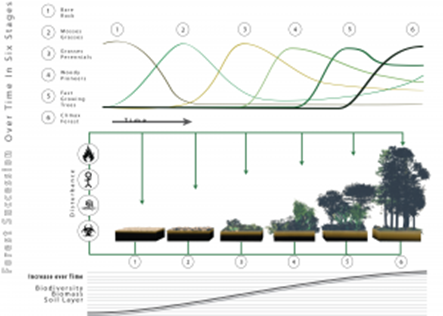
This is the change in an ecological community over time. Primary succession starts with a pioneer species colonizing bare rock or sand. Pioneer species, such as lichen, are adapted to survive harsh abiotic factors, and through their death and decomposition, they change the abiotic factors to become less harsh and form a thin layer of soil, humus. Mosses and smaller plants can now survive, and they further increase the depth and nutrient content of the soil.
This pattern continues, and as the abiotic factors continue to be less harsh, larger plants can survive and change the environment further. Each new species may change the environment in such a way that it becomes less suitable for the previous species, and they become outcompeted. Changes that organisms produce in their abiotic environment can result in a less hostile environment and increase biodiversity. The final stage in succession is known as the climax community, and this is dominated by trees.
Conservation of Habitats
The destruction of habitats, usually due to human activity, results in a loss of food and space for organisms and can lead to extinction. To conserve habitats, succession is often managed.
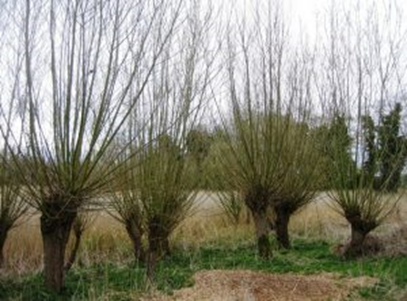
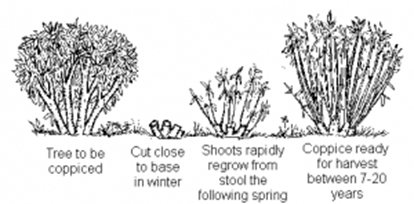
By maintaining earlier stages in succession and preventing a climax community, a greater variety of habitats are conserved, and therefore a greater range of species survive. This can lead to conflict between human needs and conservation in order to maintain the sustainability of natural resources. To try and manage this conflict, compromises are needed. For example, forests can be coppiced to provide timber for fuel and furniture while still allowing the tree to survive.
Estimating Population Size
It would be too time-consuming and inaccurate to count every individual within a population, and therefore samples are taken instead to provide an estimate. Population sizes can be estimated via a range of techniques, but there are a few aspects in common. For the sampling to provide an accurate estimate that is representative of the population size, many samples must be taken, and sampling should be random to avoid bias.
Quadrats are used to sample slow-moving or non-motile organisms (such as plants). A quadrat is a frame typically 0.5m x 0.5m in size and can be gridded or open.
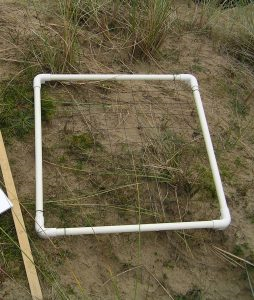
To randomly sample an area, you could place two 20m tape measures at right angles to create a gridded area to sample. Using a random number generator, such as a calculator, two values can be generated to use as coordinates in the gridded area created. The quadrat should be placed on the coordinate, and either the number of the species you are sampling could be counted or a percentage cover could be estimated. This should be repeated at least 30 times to provide a representative estimate.
Sometimes a belt transect is more appropriate than random sampling. A belt transect is when a tape measure is placed through an ecosystem that is not uniform, such as a beach rocky shore. To ensure you gather data for each area, the quadrat can be placed at intervals along the transect to measure the impact of the changes in the environment.
The three ways to estimate the population in a quadrat are frequency, density, and percentage cover. Frequency is when you record how many squares out of the 100 in a quadrat the species is present in. Density is when every individual of that species in the quadrat is counted. Percentage cover is when you estimate the percentage of the whole quadrat that is covered by the species, using the 100 grids in the quadrat to assist.
As motile organisms can move out of a quadrat, the mark-release-recapture method is used. In this method, animals are first trapped and then marked. The mark must be non-toxic, weather-resistant, and not impact reproduction or predation.
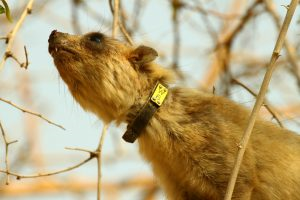
The animals are then released and left to redistribute in the population. The traps are used a few days later, and a second sample is taken. The resampling continues until at least 10 samples are collected. The population size can be estimated using the formula:
Population size = Size of 1st sample X size of second sample / Number of marked recapture
This method assumes that the marked individuals released distribute themselves evenly among the population after being released, that there is no migration, and no births or deaths.
Nutrient Cycles
Nutrients are recycled within natural ecosystems, exemplified by the nitrogen cycle and the phosphorus cycle.
Mycorrhizae play an important role in nutrient cycles. Mycorrhizae are fungal associations between plant roots and beneficial fungi. As a result, the fungi entwined around the plant roots provide a larger surface area for water and mineral absorption. The fungi part of the mycorrhizae acts like a sponge and can absorb and hold onto water and minerals surrounding the root. This is of benefit to the plant, as in times of drought, the mycorrhizae store of water and minerals can be used. This is a mutualistic relationship because the plant provides the fungi with carbohydrates.
Energy Transfers
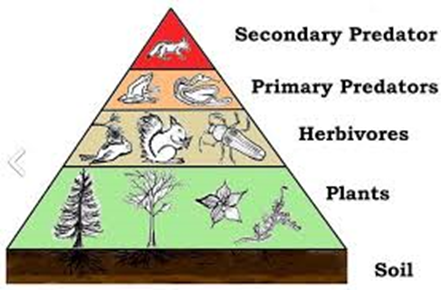
In any ecosystem, plants are the producers in a food web as they are able to produce their own carbohydrates using carbon dioxide in the atmosphere or water.
Between each trophic level in a food web, the majority of the energy is lost due to respiration and excretion. The remaining energy is used to form the biomass.
The amount of biomass remaining in an organism can be measured in terms of the mass of carbon or dry mass of tissue per given area. How productive an ecosystem is dependent on the abiotic and biotic factors. Plenty of water, light, warmth, and green plants will maximize the rates of photosynthesis and therefore result in more carbohydrates being produced in the plants. This can be quantified using GPP and NPP.
Gross primary production (GPP) is the chemical energy stored in plant biomass in a given area or volume. It is the total energy resulting from photosynthesis.
Net primary production (NPP) is the chemical energy stored in plant biomass, taking into account the energy that will be lost due to respiration (R).
NPP = GPP – R
The NPP is the energy left over that is available to the plant to create new biomass and therefore available to the next trophic level in a food web.
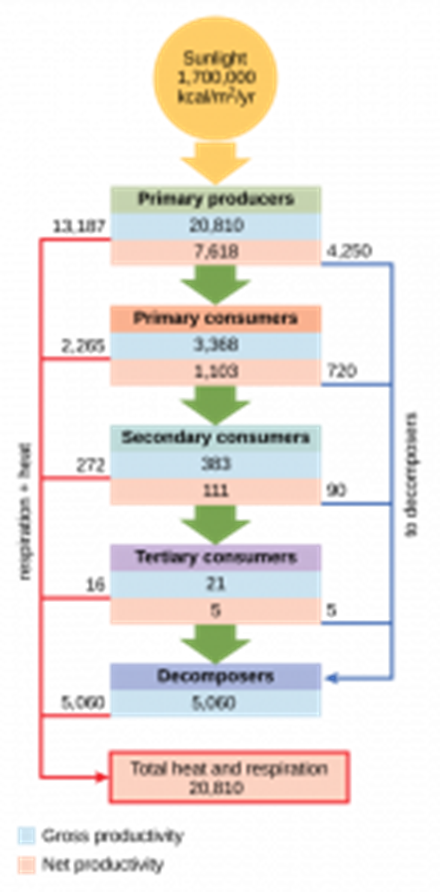
Rates of productivity are recorded using the units kJ ha–1 year–1. kJ is the unit for energy, but these units also include per unit area and per year. It is recorded as per unit area to standardize the results to enable environments to be compared - it takes into account that different environments will vary in size. The units are also per year to take into account the impact seasons will have on rain, light, and heat – it provides an annual average to allow fair comparisons between environments.
The Carbon Cycle
The carbon cycle is also dependent on organisms. Plants photosynthesize to fix carbon from the atmosphere, carbon dioxide, into carbohydrates which can be ingested by animals. All organisms respire, and this converts the carbon in carbohydrates back into carbon dioxide in the atmosphere or oceans. When organisms die or excrete, the carbon is broken down to carbon dioxide by decomposers that respire on the carbohydrates within the dead or waste matter.
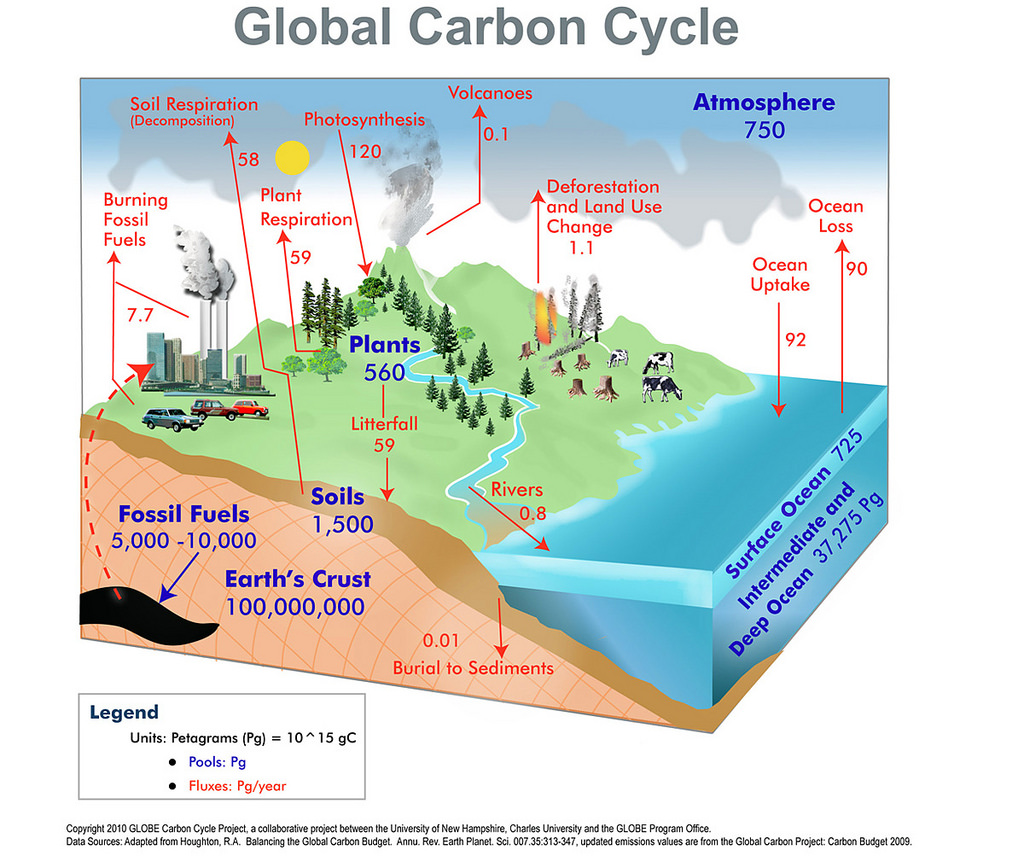
An imbalance in this cycle is leading to ocean acidification and global warming. This imbalance is caused by deforestation and burning too many fossil fuels, therefore less carbon dioxide is being used in photosynthesis and more is being produced by combustion.
- What is an abiotic factor?
- Your answer should include: Non-Living / Factor
- What is a community?
- Your answer should include: Individuals / Species
- What is an ecosystem?
- Your answer should include: Biotic / Abiotic / Factors
- Why should you sample randomly?
- Your answer should include: Avoid / Bias
- Why is it important to take a large number of samples?
- Your answer should include: Population / Statistics
- What is primary succession?
- Your answer should include: Succession / First / Time
- How could you simplify a food web?
- Your answer should include: Trophic / Levels / Herbivores
- Why would a farmer want to simplify a food web?
- Your answer should include: Reduce / Wasted / Energy
- How is energy lost between trophic levels?
- Your answer should include: Respiration / Faeces / Urine
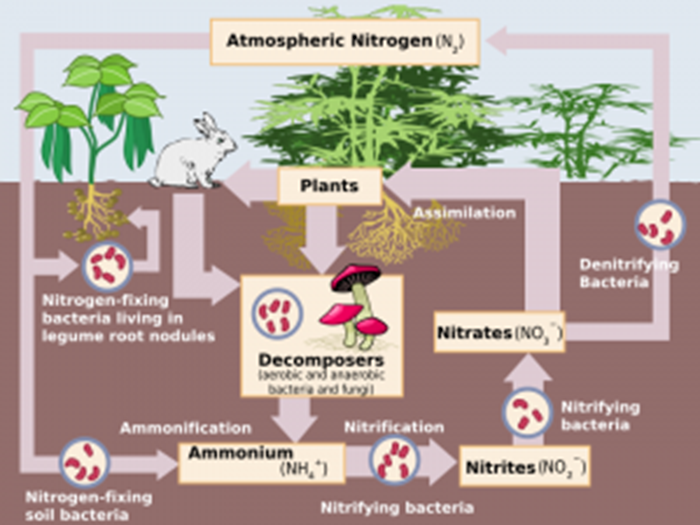
Nitrogen Cycle
Nitrogen is an important element that is needed to create amino acids/proteins, DNA, RNA, and ATP.
The cycle is split into four key processes: nitrogen fixation, nitrification, denitrification, and ammonification.
Nitrogen Fixation
Nitrogen-fixing bacteria, such as Rhizobium and Azotobacter, are able to break the double bond between the two nitrogen atoms in nitrogen gas in the atmosphere and fix this nitrogen into ammonium ions. The bacteria is either free-living in the soil (Azotobacter) or it is symbiotic (mutualistic relationship), living in the root nodules of plants (Rhizobium). This is common in leguminous plants such as clover and beans.
Nitrification
The ammonium ions in the soil are converted to nitrite and then nitrate ions in the soil by nitrifying bacteria, Nitrosomonas and Nitrobacter. This is a two-stage oxidation reaction.
Denitrification
This stage is not useful as it returns the nitrogen in compounds back to nitrogen gas in the atmosphere, so it cannot be absorbed by plants. Anaerobic denitrifying bacteria do this.
Ammonification
Proteins, urea, and DNA can be decomposed in dead matter and waste by saprobionts. These are bacteria and fungi that can digest waste extracellularly. This is saprobiotic nutrition and returns ammonium ions into the soil.