Contents
Biodiversity
Biodiversity
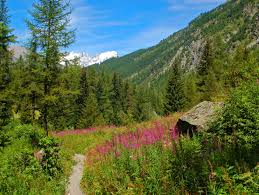
There are different meanings of biodiversity, and it can be a measure of the range of habitats, from a small local habitat to the Earth. For example, the range of habitats in the UK includes sand dunes, woodlands, meadows, streams, and many more.
The term habitat refers to the range of physical, biological, and environmental factors in which a species can live.
Biodiversity can also be a measure of species biodiversity, and this can be measured using species richness and evenness. Species richness is a measure of the number of different species in a community, whereas species evenness is the relative abundance of each different species. A community is all the organisms living in a particular area at a particular time. The more species there are, the richer the area is in species. Species richness only accounts for how many different species there are, and not the population size of each species.
The final way to measure biodiversity is in terms of genetic biodiversity. This would take into account different alleles and breeds within a species. Genetic diversity can actually be calculated within isolated populations, such as zoos (captive breeding), rare breed and pedigree animals. The formula is:
proportion of polymorphic gene loci = number of polymorphic gene loci / total number of loci
Having low biodiversity isn't necessarily an issue. For example, deserts and arctic regions naturally have low biodiversity due to the harsh environment. It is a cause for concern if an ecosystem experiences a loss in biodiversity, as this indicates a change is causing the loss of habitats and therefore death and extinction of species often follows.
Measuring Diversity
An index of diversity combines both the number of different species and the population size of each within a community.
The index of diversity of a community can be calculated using the formula below:
D = N (n-1) / ∑ n(n – 1)
- D = diversity
- N = the total number of organisms of ALL species
- n = total number of organisms of a particular species
Humans are the biggest cause of loss of diversity in communities, which can inevitably lead to extinction. Extinction of species is negative for many reasons ranging from ethical, economical, and medicinal. Firstly, if humans are the cause of extinctions, it is our moral duty to put measures in place to try and prevent this. Economically, tourism often relies on people visiting areas of natural beauty and observing animals in their natural habitat. Extinction of habitats, plants, and animals could reduce tourism and therefore impact the economy. Finally, many medicines have been based on chemicals naturally occurring in plants, so plant species going extinct could have potentially held the molecules needed to cure diseases in humans.
Farming techniques, in particular, reduce biodiversity. Removing natural habitats, such as forests, grasslands, and hedgerows in fields, for agriculture removes many habitats. Removal of these habitats also removes food sources for animals. It is therefore essential to put in place conservation measures to protect these habitats, but not to an extent that farming is no longer possible, and humans run out of food.
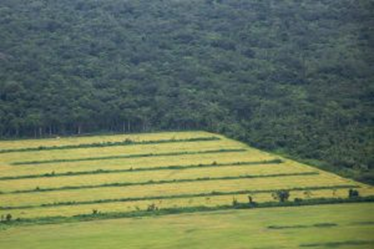
The key for ecologists is therefore finding the balance between conservation and farming.
Classification and Evolution
Species
The definition of a species is if two organisms can produce fertile offspring.
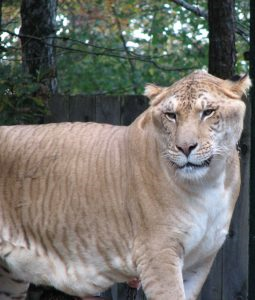
Whilst some members of different species can reproduce to make offspring, the offspring are infertile and therefore classed as hybrids and not a species. E.g. a lion and a tiger can reproduce to make a liger or a tion.
Two other factors to consider are:
Firstly, do they have similar physical features, biochemistry, and DNA, but this alone cannot be used because individuals within a species do not have identical features, but also can have similar features to members of different species. Different species often look very similar, but this is because they have both evolved over time to have similar adaptations to their environment.
Secondly, they must occupy the same ecological niche.
Binomial Naming System
The way species are named is universal. The reason for this is so that different names are not used in different countries, which could lead to errors in estimates of the number of individuals of different species. The naming system used in the binomial system, where individuals are named by their genus and species, e.g., Homo sapiens are humans.
Individuals can be classified according to their physical and biochemical similarities.
The Linnaeus classification system is a hierarchical system that is made up of the following taxa:
- Domain
- Kingdom
- Phylum
- Class
- Order
- Family
- Genus
- Species
This hierarchical system uses smaller groups placed within larger groups, but there are no overlaps between each group.
Each level is known as a taxon (taxa plural). There are millions of species (that we know about), and we need a system to organize them. The reason for this is to aid us in understanding relationships between organisms and keep track of changes. For this reason, the system is universal.
Below is an example using the human classification:
• Domain = Eukaryote
• Kingdom = animalia
• Phylum = chordata
• Class = mammalia
• Order = primates
• Family = hominidae
• Genus = Homo
• Species = sapiens
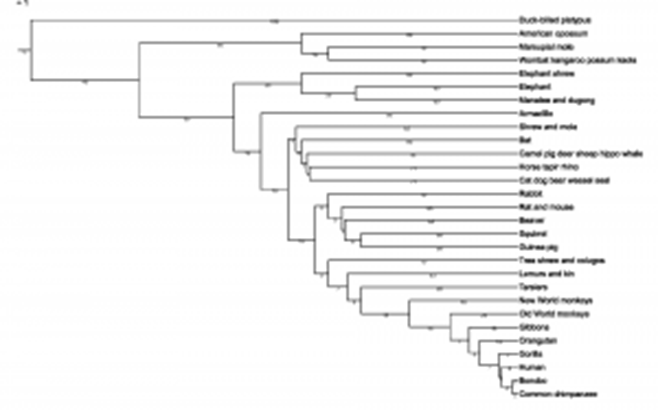
Individuals can also be classified using the phylogenetic system. This is when species are grouped according to their evolutionary origins and relationships.
Phylogeny is the study of the evolutionary origins of groups of organisms. It is a way to determine how closely related species are.
All organisms have evolved from shared common ancestors (relatives). This is shown on a phylogenetic tree, see below. Each branch in the phylogenetic tree indicates a common ancestor the species evolved from.
The accuracy of classification and phylogenetic trees is improving due to advances in immunology and genome sequencing.
The DNA base sequence of organisms for particular genes can be compared as a measure of how closely related organisms are. This is because the more closely related the species, the higher the degree of similarity in the base sequences. Distantly related organisms usually show fewer similarities. This is because mutations accumulate over time.
The sequence of amino acids in the polypeptide chain of proteins can also be compared because this sequence is determined by DNA. The degree of similarity between the amino acid sequence of the same protein in 2 species will show how closely related they are. The common protein that is compared between species is cytochrome C, which is found in the mitochondria because most species have this protein.
Genetic Diversity
Genetic diversity is the number of different alleles in a population.
A gene pool can be described as all the genes and alleles in a population at a particular time. The allele frequency is the proportion of organisms within the population carrying a particular allele. The genetic diversity of a population is what enables natural selection to occur.
Variation can be either continuous or discontinuous. Continuous refers to traits that are controlled by many genes and the environment can have an impact; this is represented graphically using a histogram. Discontinuous variation refers to traits that are controlled by a single gene and the environment has no impact, therefore individuals fit into particular categories and this is represented with a bar chart.
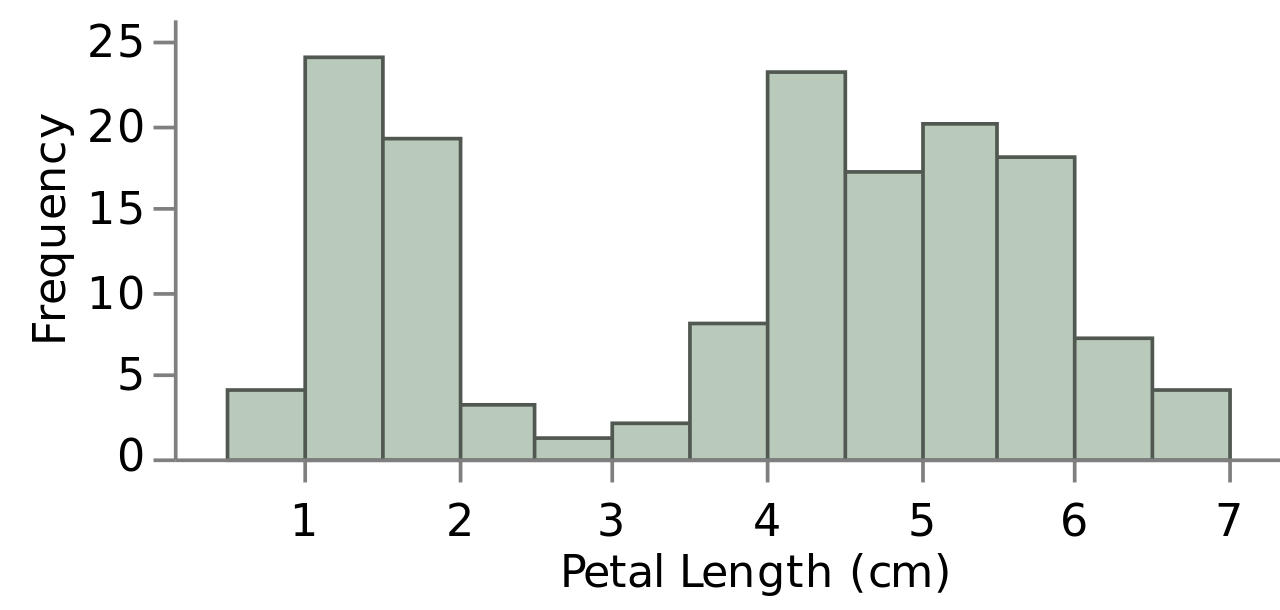
Petal length is an example of continuous variation:
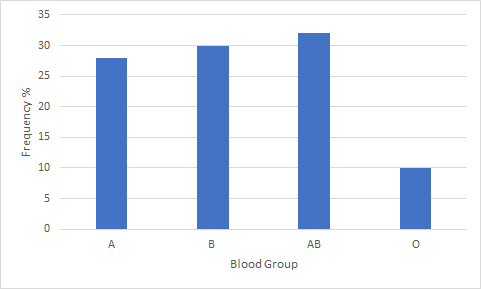
Blood group is an example of discontinuous variation.
Investigating Variation
When measuring variation within a population, samples are taken. This is because it would be too time-consuming and potentially impossible to record data on every individual within a population. To ensure your sample is representative of the population, you must take a large sample and to avoid bias, you should randomly sample.
By collecting a large number of samples, you can also calculate a mean and do a statistic or standard deviation to see if any differences or correlations you see are significant.
Types of Selection
Selection causes some alleles to become more frequent in a population, whereas others may be lost. Selection pressures, e.g., the type of food available, determine which alleles are successful.
Two key types of selection are directional and stabilizing.
Stabilizing selection is when the middle trait has the selective advantage and therefore continues to be most frequent in the population. This impact can be represented by a normal distribution graph below. The range decreases as the extreme traits are lost over time.
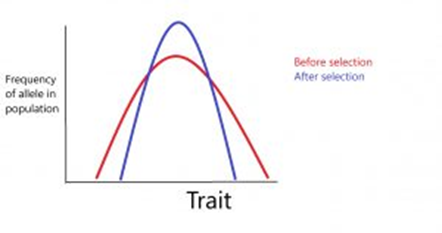
A common example of stabilizing selection is human birth weight. A middling birth weight is the selective advantage as extremely low birth weights may be disadvantageous to survival due to the underdevelopment of the baby and an extremely large birth weight may lead to complications in the birth. Therefore, babies born with a middling weight are more likely to survive and pass on the allele to their offspring later in life.
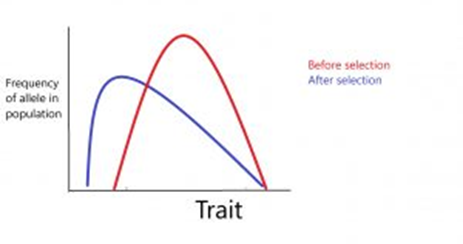
Directional selection is when one of the extreme traits has the selective advantage. The result of this is demonstrated on the graph below.
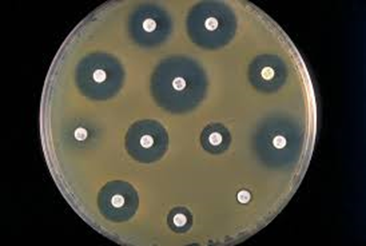
Antibiotic resistance is an example of directional selection. Antibiotic-resistant bacteria can be tested by growing bacteria, using aseptic technique, and exposing them to different antibiotics.
Aseptic technique is when microbes are grown in sterile conditions. This includes disinfecting all surfaces you will work on, washing your hands with soap, and sterilizing all equipment. Bacteria, such as E.coli, are evenly spread over a petri dish filled with agar. Discs of paper soaked in different antibiotics are then placed on the petri dish. This is sealed and left to grow at 25C for a few days. After this incubation period, if there are any clear zones around the paper discs, or inhibition zones, this indicates that the bacteria have been killed by the antibiotic. Any discs that do not have an inhibition zone around them indicate that the antibiotic did not kill the bacteria. To determine which antibiotic is the most effective, the diameter of the inhibition zone can be measured, and the largest diameter indicates the most bacteria killed.
Natural Selection
Natural selection is the process that leads to evolution. The theory was initially proposed by Alfred Russel Wallace. He worked with Charles Darwin to publish scientific journals in 1858 on this, and later Darwin independently published 'On the Origin of Species' in 1859.
Natural selection is the process that leads to evolution within a population.
Describing the process of natural selection is often a 5-mark question:
- Random mutations occur within the population.
- This introduces genetic variation to the population.
- While some mutations are harmful, sometimes new alleles created by mutations provide organisms with an advantage to survive in their environment.
- The new allele provides a reproductive selective advantage. Therefore, the individual with the allele is more likely to reproduce and pass the allele onto their offspring.
- Over many generations, there will be an increase in the frequency of this allele within the population.
This change in the allele frequency in a population is what evolution is. The end result is that species are better adapted to their environment. Adaptations can be classified as either anatomical, physiological, or behavioral. Below, each of these adaptations is applied to the hedgehog.
Anatomical - spikes on a hedgehog
Physiological - hedgehogs hibernating and slowing their metabolic reactions in winter
Behavioral - Hedgehogs curling up when in danger.
- What is a mutation?
- Your answer should include: Change / Structure